The history of recorded sound goes right back to the 1850s with the invention of the phonautograph, a machine that used a rotating drum, a feather, some soot, and a funnel to record the vibrations of the human voice. The machine was based upon the construction of the human ear. It could not play back its recordings, but represented them as wavy lines on paper, allowing sound to be seen for the first time. Those early crude recordings were only first heard in 2008, just recognisable as someone singing the song Au Claire de la Lune. The story behind playing them – The Phonautograph Diaries (PDF) – makes for fascinating reading.
In 1877 Thomas Edison invented the phonograph, a device that recorded sound by engraving vibrations onto a rotating cylinder coated with tin foil. This was later improved by using hardened wax. By 1885 prerecorded wax cylinders were being sold commercially. Then we have the invention of the gramophone, vinyl records, magnetic tape, and myriad other formats as we moved into the age of digital recording.
Preserving old recordings is as important as as preserving old documents, books, art and artefacts, perhaps more so given their limited shelf-life on unstable media.
There is something magical and immediate about hearing voices and music from the past. Whether that’s music from the 19th century, hearing an actual voice from the 1880s, or listening to an oral history recording from the 1970s of someone reminiscing about a way of life now gone – there’s something about hearing them first-hand today – a tangible connection with the past.
But sometimes listening to old recordings can be difficult and challenging. Old technologies such as cylinders, gramophone records and magnetic tape were not particularly high fidelity. Hiss, hum, scratches, and varying pitch interfere with the subject matter. Magnetic tape degrades through time, and chemical reactions caused by age, heat, humidity and other factors can leave them muffled – or even unplayable. Repeated plays of cylinders, gramophone or vinyl discs can wear out the grooves creating all manner of noise to get in the way of the recording.
Digitally remastered
There have been plenty of ways to enhance old recordings and make them more ‘listenable’ since the 1960s. Most people old enough to have grown up with tape recordings have heard of Dolby noise-reduction which helped to reduce tape hiss (often at the sacrifice of overall sound quality). You may also find in today’s music streaming services versions of very old vinyl and tape albums ‘digitally remastered’.
Digitisation of old recordings allows for more advanced fixes to improve the audio quality – or perhaps ‘listenability’ – making them nicer to listen to and more aligned with our experience of our own experience of hearing. Something crackly and faint suddenly becomes clear and audible. It helps the listener connect with the recording if it sounds good.
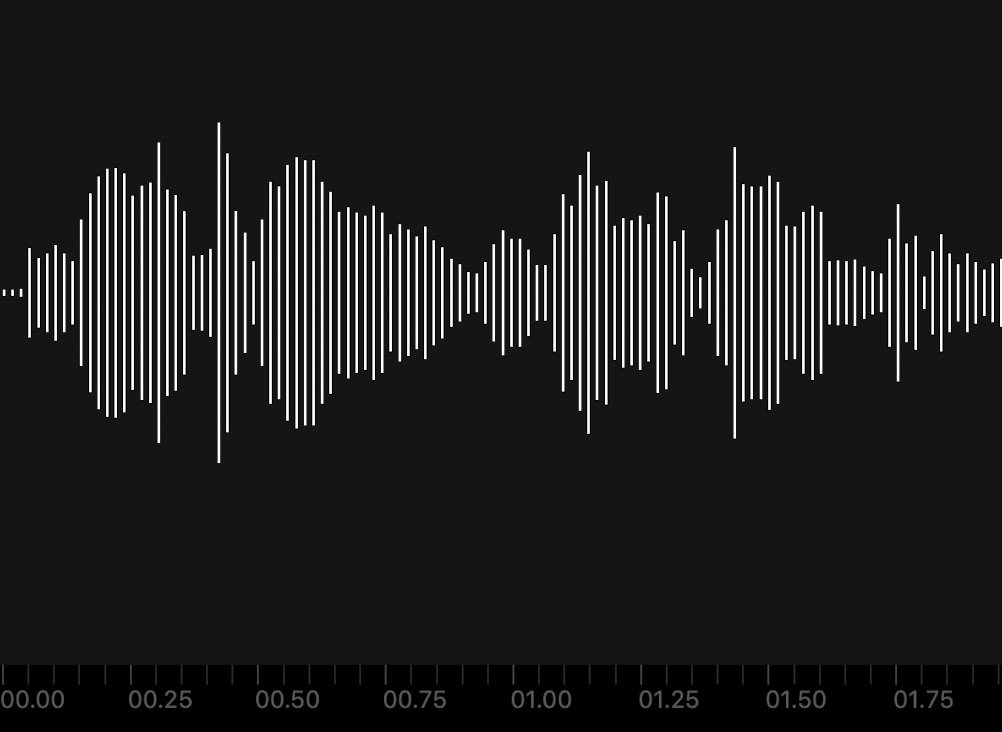
The process of digital audio restoration permits the sound to be represented visually. Most common is a visualisation called a waveform. This is a graph with time along the X (horizontal) axis and volume, or amplitude, along the Y (vertical) axis.
Software can help us to make old recordings much more compelling to listen to, and help listeners relate to them in a more meaningful way. It is equally important to preserve the original recordings so that they can be heard ‘as is’ and to allow for more advanced techniques to be used in the future.
The future is a dubious place for much of our sound heritage because of the natural fragility of magnetic tape, and even CDs and disk drives.
Machine learning and spectrograms
I have been involved with preserving old recordings for many years and have followed the advances in audio restoration with great interest. During the Covid-19 lockdown in the UK I began to develop those skills and try out some of the more recent advances in the technology through the use of machine learning and spectrograms – a visual representation of the spectrum of frequencies of a sound as it varies with time. In effect, a way of seeing sound in a novel way. My first experience of seeing a sound this way was exciting. Perhaps not as excited as Édouard-Léon Scott de Martinville in the mid 1850s, but not far off.
That same recording, of me saying the words “Curatorial Research Centre” represented as a spectrogram looks like this:
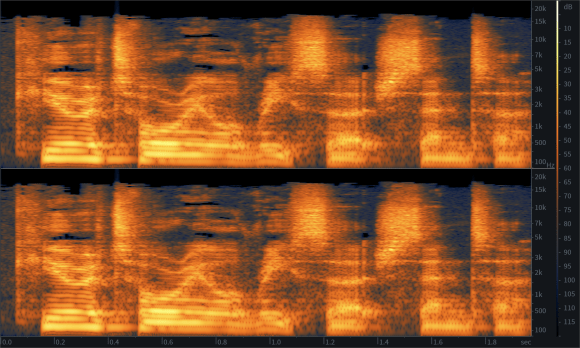
There are two images here – one above the other representing the left and right channels (stereo). Time in seconds is along the X axis (left to right) and frequency is along the Y axis (bottom to top).
The colours at the bottom show the lowest, bass frequencies, all the way up to the top with the highest frequencies (hiss, sibilance). The ‘heat’ of the colours, which goes from cold black and dark blue up to hot white and yellow represents the volume or amplitude of those frequencies. Black and blue is very quiet and yellow and hot white are loud.
The long lines which seem to radiate from the bottom to the top are harmonics – the human voice is made from many frequencies that sound at the same time. Following from left to right in the middle you might be able to spot, if you say “Curatorial Research Centre” aloud, the rise and fall in cadence of the phrase.
Listen with your eyes
Listen to the audio clip above, the spectrogram below is annotated to help you see what you have just heard.
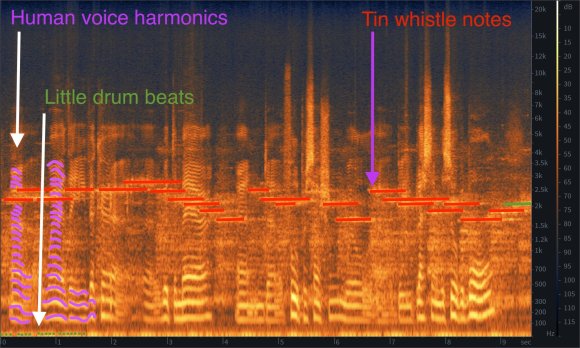
In this example, recorded in 1974 in St Ives, Cornwall, you can hear a man’s voice in a large room with a musician playing a tin whistle whilst a small drum is tapped in the background. The red lines highlight the notes played on the whistle, how long they are each played for, and you can follow the tune by how high or low the lines are relative to pitch. The big wavy lines highlighted in purple are the voice. The little green dots at the bottom represent the low frequencies of a small drum being tapped rhythmically. A complete picture of the sound.
Being able to see sound in this way, once you understand how the spectrogram works, combined with critical listening, allows for problems in the audio recording to be identified. Intelligent software allows us to isolate certain sounds and correct them. We can teach software through machine learning, to identify sounds like hiss, pops, crackles and hum, and remove them without sacrificing sound quality.
Hearing that restored recording was like being back in 1967 all over again, in the nave of Beverley Minster with that beautiful music.
Recordist of 1967 recording by organist Alan Spedding.
We were recently approached by someone who had, as a student, made a recording of a recital by the organist Alan Spedding in Beverley Minster in 1967. Recorded on 1/4″ magnetic reel tape using a basic microphone, he was incredibly attached to the performance that he captured that day.
Could we digitise it for him, and produce a CD? The owner of the tape also had a 1/4″ reel-to-reel machine which had recently been serviced. Taking no risks, we digitised the tape during its first play in many years, capturing it at studio-grade quality (32bit, 96Khz).
The first listen identified many issues to address: 50Hz mains hum (caused by the electricity supply when originally recorded), high amounts of tape noise (hiss) that stifled the harmonics of the wonderful organ, some clicks and pops, a strange shimmering intermittent hiss, and the clattering sound of a chair falling over at an unfortunate moment in the recording.
Before and after
Here is a short extract from the start of the tape, as digitised:
Here is the result of using the spectrogram to make informed choices about restoring the audio:
After discussion, we opted to undertake a light-touch restoration. Rather than to apply modern production aesthetics and make it sound like new, we opted to fix the main problems with the recording only and preserve the warmth and character of the original medium.
After the restoration of the recording was complete, the owner of the recording was quite emotional. He said, “hearing that restored recording was like being back in 1967 all over again, in the nave of Beverley Minster with that beautiful music.” If the recordist is happy after 53 years, then so are we.
If you have any recordings that are marred by any kind of artefacts that impair its value or impact, digitised or otherwise, do contact us to see how me might be able to help you. We can provide audio restoration services, as well as advice on how your audio might be used as part of the curatorial process in exhibitions, online and other contexts.